Unleash the Power of Data: Choosing the Right BI Tool
Understanding the vast amounts of data available is crucial for success in today's business world. Business Intelligence (BI) tools offer the ability to transform raw data into actionable insights. This empowers businesses to make informed decisions, optimize strategies, and gain a competitive advantage. With so many BI platforms available, finding the right one for your specific needs can be challenging. Whether you're a data visualization expert, a business professional, a digital marketer, or anyone working with data, selecting the right BI tool is essential.
The right BI tool can address a variety of data challenges, offering features like interactive dashboards, compelling visualizations, robust reporting, and even predictive analytics. When evaluating BI tools, key factors to consider include data source connectivity, ease of use and deployment, scalability, and embedded analytics capabilities. A truly effective BI tool enables users to easily explore data, identify trends, and uncover hidden patterns. Sharing these insights with stakeholders in a clear and compelling manner is equally important. Pricing models and technical requirements, such as on-premise versus cloud-based deployment, also play a significant role in the selection process.
This guide explores the top 10 BI tools of 2025. We'll provide an in-depth analysis of their strengths, weaknesses, and ideal use cases. By the end, you'll have the knowledge to confidently compare BI tools and select the perfect platform to transform your data into a strategic asset.
1. Tableau
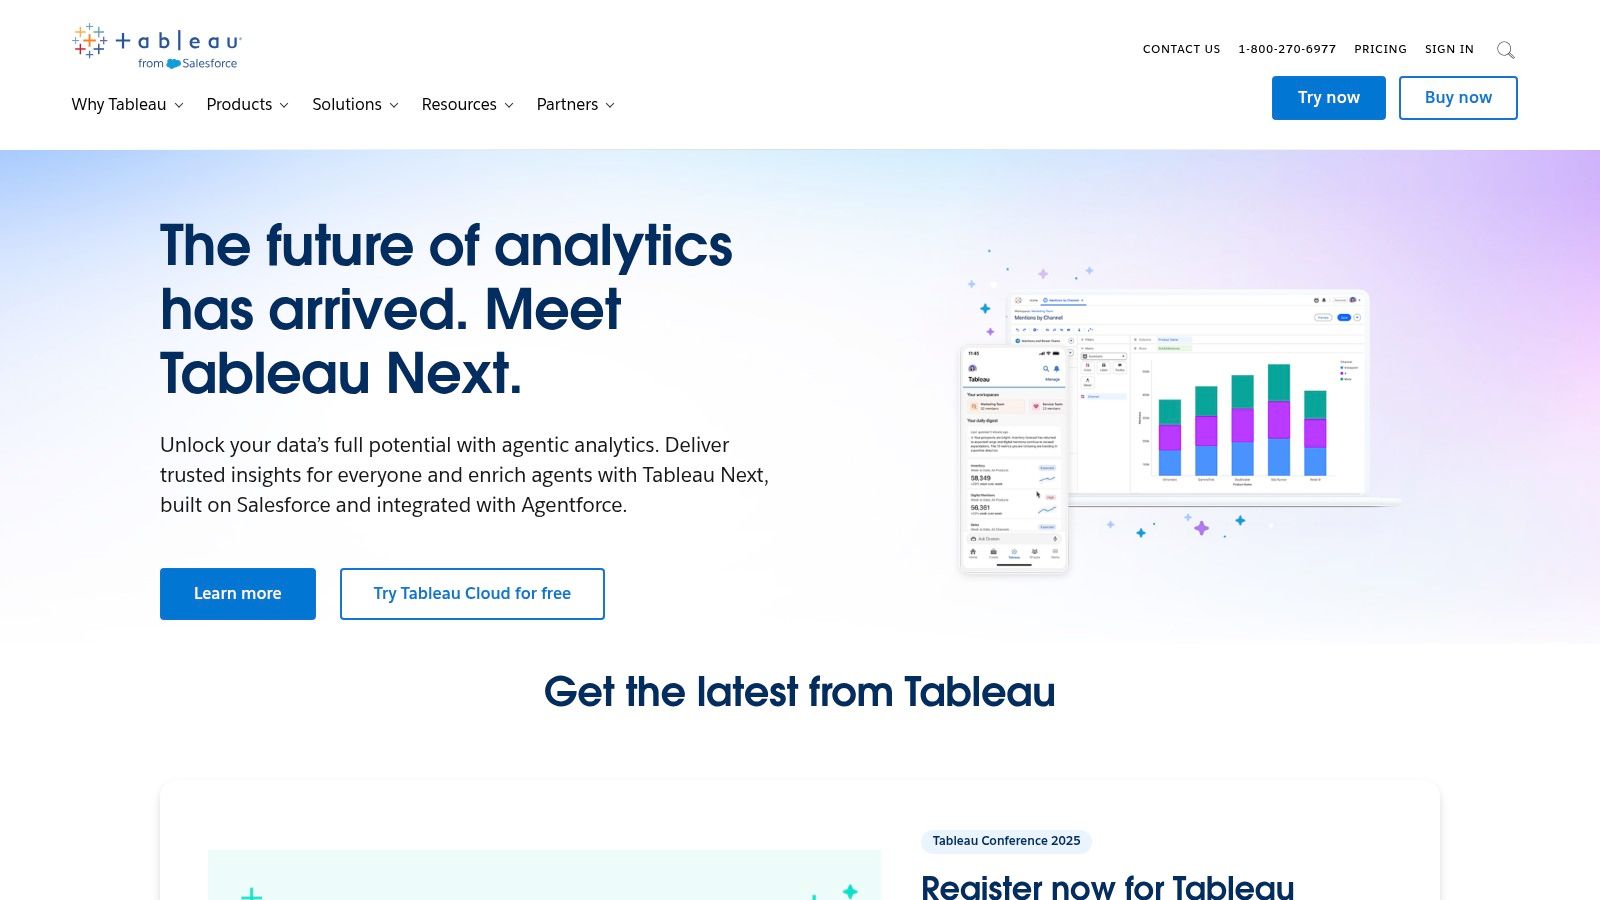
Tableau is a leading visual analytics platform renowned for its powerful data exploration and impressive visualization capabilities. It allows users to transform raw data into actionable insights through interactive dashboards and reports. This makes it a valuable asset for various professionals, from business analysts to data scientists. While the price point is higher than some competitors, its intuitive interface and extensive features make it a worthwhile investment for organizations needing robust data visualization solutions.
Tableau caters to diverse use cases across many industries. Digital marketers can use it to analyze campaign performance, track important metrics, and visualize customer behavior. Business professionals can create interactive sales dashboards, monitor financial performance, and identify key trends. Tech enthusiasts and data scientists will appreciate its advanced analytics capabilities, including built-in statistical functions and broad data source connectivity. Even remote workers benefit from Tableau's mobile-responsive dashboards, providing access to critical data from anywhere.
Key Features and Benefits
-
Interactive Drag-and-Drop Interface: Tableau's intuitive interface enables users to create complex visualizations easily, minimizing the need for coding. This drag-and-drop functionality makes it accessible to a wider audience, regardless of technical background.
-
Robust Data Connectors: Connect to a vast array of data sources, from spreadsheets and databases to cloud platforms and big data systems. This versatility allows users to analyze data from various sources within a single platform.
-
Advanced Analytics: Go beyond basic visualizations with built-in statistical functions and powerful data exploration tools. Discover hidden patterns, identify outliers, and perform statistical analysis directly within the Tableau platform.
-
Mobile-Responsive Dashboards: Access and interact with dashboards on any device, ensuring data-driven insights are readily available. This is particularly beneficial for remote workers and executives who need on-the-go access.
-
Tableau Prep: This companion product simplifies the often tedious tasks of data cleaning and preparation, allowing users to transform and shape their data before visualization.
Pros
-
Exceptional Visualization Capabilities: Create stunning, interactive visualizations that effectively communicate complex data insights.
-
Intuitive User Interface: Tableau is easy to learn and use, even for those with limited technical skills.
-
Strong Community and Resources: A wealth of online resources, tutorials, and community forums provide ample support and guidance.
-
Powerful Data Exploration Tools: Dive deep into data to uncover valuable insights and emerging trends.
Cons
-
Cost: Tableau's pricing can be a significant investment, especially for smaller businesses or individual users.
-
Advanced Features Learning Curve: While the basic interface is user-friendly, mastering the more advanced features requires additional time and effort.
-
Resource Intensive: Running complex dashboards can demand significant computing resources.
-
Limited Formatting: Some users may find the formatting options for specific visualizations somewhat restrictive.
Additional Information
Pricing: Tableau offers a range of subscription options tailored to different user types and deployment methods. Check their website for detailed pricing information.
Technical Requirements: Tableau Desktop and Tableau Server have specific system requirements related to operating system, memory, and disk space. Consult the official documentation for the latest details.
Implementation Tips:
- Start with a clear understanding of your data and your goals for analysis.
- Utilize the available online resources and tutorials.
- Explore the platform’s capabilities with a free trial.
- Consider Tableau training sessions to develop more advanced skills.
Website: https://www.tableau.com/
2. Microsoft Power BI
Microsoft Power BI is a powerful business analytics service that helps organizations make data-driven decisions. It transforms raw data into interactive visuals and insightful reports, making it a popular choice for businesses of all sizes. Power BI's seamless integration with the Microsoft ecosystem is a key advantage for companies already invested in that environment.
One of Power BI's strengths is its ability to connect to a wide range of data sources. From simple Excel spreadsheets and databases to cloud services like Azure, Power BI can pull data together to create comprehensive dashboards that tell a story. This allows businesses to create a central hub for all their important data.
Practical Applications of Power BI
Power BI's versatility makes it applicable across various departments:
- Marketing: Track campaign performance, analyze customer behavior, and visualize key metrics like conversion rates and ROI.
- Sales: Gain insights into sales trends, identify top-performing regions, and generate accurate sales forecasts.
- Finance: Use Power BI for budgeting, financial reporting, and performance analysis.
Furthermore, embedded analytics features let businesses integrate interactive reports directly into their applications or websites, providing a richer user experience.
Power BI Pricing and Features
Power BI offers a tiered pricing model:
- Free Desktop Version: For individual users looking to explore the platform.
- Pro: Enhanced collaboration, data governance, and content sharing for teams.
- Premium: Advanced AI capabilities, larger dataset handling, and dedicated capacity for enterprise-level needs.
For more options, you can explore similar tools by checking out this article about Power BI Alternatives & Competitors.
Key Features of Power BI
- Microsoft Ecosystem Integration: Connect and analyze data from Excel, SharePoint, Dynamics 365, and Azure services.
- Natural Language Query (Q&A): Ask questions using everyday language and get instant visual answers.
- AI-Powered Analytics: Discover hidden insights and patterns with automated machine learning.
- Custom Visuals: Create and share bespoke visualizations tailored to specific needs using Power BI Desktop.
- Embedded Analytics: Integrate interactive reports directly into applications and websites.
Pros and Cons of Using Power BI
Pros:
- Cost-Effective: The tiered pricing model caters to various budgets.
- Strong Data Governance: Robust security and access controls ensure data integrity.
- Frequent Updates: Microsoft continually adds new features and improvements.
- Excellent Microsoft Integration: Works seamlessly with other Microsoft products.
Cons:
- Performance with Large Datasets: Can slow down when processing very large datasets.
- Customization Limitations: Some users might find customization options less extensive than other BI tools.
- DAX Learning Curve: The Data Analysis Expressions (DAX) language can be challenging for beginners.
- Premium Features: Some advanced AI and large dataset handling features require the Premium subscription.
Tips for Implementing Power BI
- Define Objectives: Start with a clear business objective and key metrics.
- Data Modeling: Connect and model your data effectively for optimal performance.
- Built-in Templates: Utilize templates and dashboards to get started quickly.
- Q&A Feature: Explore data and generate insights using the natural language Q&A feature.
- Learn DAX: Invest time in learning DAX for advanced analytical capabilities.
Website: https://powerbi.microsoft.com/
Power BI's strong data visualization, deep Microsoft integration, and flexible deployment options make it a valuable tool. While the DAX learning curve and potential performance issues with large datasets are worth considering, its extensive features and regular updates make it a strong choice for data-driven decision-making.
3. Qlik Sense
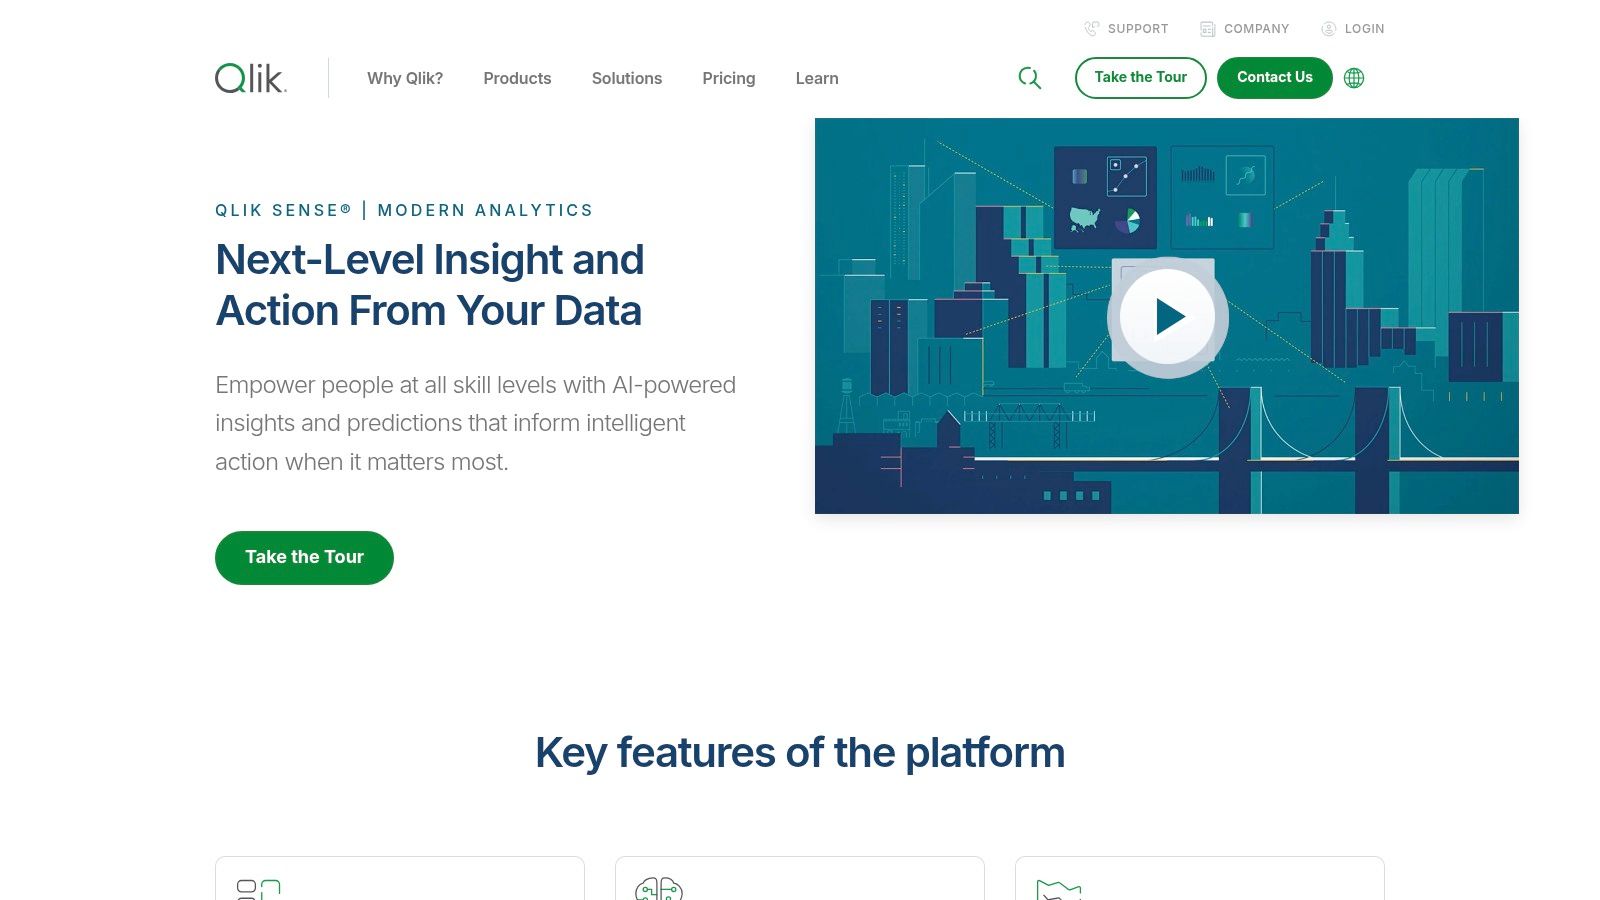
Qlik Sense is a powerful and comprehensive data analytics platform. It caters to a wide range of users, from business analysts to data scientists. Its Associative Engine sets it apart, allowing users to explore data relationships in a way that traditional query-based Business Intelligence (BI) tools can't. This makes it especially effective for uncovering hidden insights.
Qlik Sense excels in empowering users with self-service analytics. Business professionals and digital marketers can create interactive dashboards and reports without needing extensive technical skills. The platform's conversational analytics capabilities further enhance accessibility. Users can ask questions using natural language and receive data-driven answers. This is particularly helpful for remote workers who need quick access to insights.
For data scientists and other technically-minded users, Qlik Sense offers advanced features. These include AI-powered insights and augmented analytics, automating data discovery and suggesting potential areas for further investigation. The platform's multi-cloud architecture provides flexibility and scalability for enterprise deployments. Robust data governance and security features ensure data integrity. Even entertainment consumers can benefit from Qlik Sense, through improved content recommendations and personalization driven by its sophisticated data analysis.
Key Features and Benefits
-
Associative Engine: Explore all data relationships, uncovering hidden connections traditional BI tools might miss. This is especially useful for complex datasets where the relationships between different data points aren't obvious.
-
AI-powered Insights: Automated data discovery and predictive analytics help users identify trends and patterns quickly, facilitating faster decision-making.
-
Self-Service Data Preparation: Users can prepare and transform data independently, reducing reliance on IT and accelerating the analytics process.
-
Multi-Cloud Architecture: Deploy Qlik Sense on your preferred cloud platform, ensuring flexibility and scalability.
-
Augmented Analytics: Receive AI-driven suggestions and insights, simplifying complex analysis and empowering users with data-driven recommendations.
-
Robust Mobile Experience: Access and interact with dashboards and reports on the go, ensuring continuous access to important information.
-
Strong Offline Capabilities: Work with data and dashboards even without internet access, ideal for remote workers or frequent travelers.
Pros and Cons
Here's a quick breakdown of the advantages and disadvantages of using Qlik Sense:
Pros:
- Powerful associative data model for uncovering hidden relationships
- Strong data governance and security features
- Excellent mobile experience for on-the-go access
- Robust offline capabilities
Cons:
- Steeper learning curve compared to simpler BI tools
- Higher cost for enterprise deployments
- Interface can feel somewhat dated compared to newer tools
- Documentation could be more comprehensive
Pricing and Technical Requirements
Qlik Sense offers a variety of licensing options based on user types and deployment needs. Contact Qlik sales for detailed pricing information. Technical requirements vary depending on the deployment type (cloud or on-premise). Refer to the Qlik Sense documentation for specific requirements.
Implementation/Setup Tips
- Start with a clear understanding of your business needs and analytical goals.
- Invest in appropriate training for your team to maximize the platform's potential.
- Leverage Qlik's extensive online resources and community forums for support and best practices.
Comparison with Similar Tools
Compared to tools like Tableau and Power BI, Qlik Sense stands out with its Associative Engine. While other tools mainly rely on query-based exploration, Qlik Sense allows users to freely explore all possible data combinations. This reveals hidden connections that other tools might miss.
Website: https://www.qlik.com/us/products/qlik-sense
4. Looker (Google Cloud)
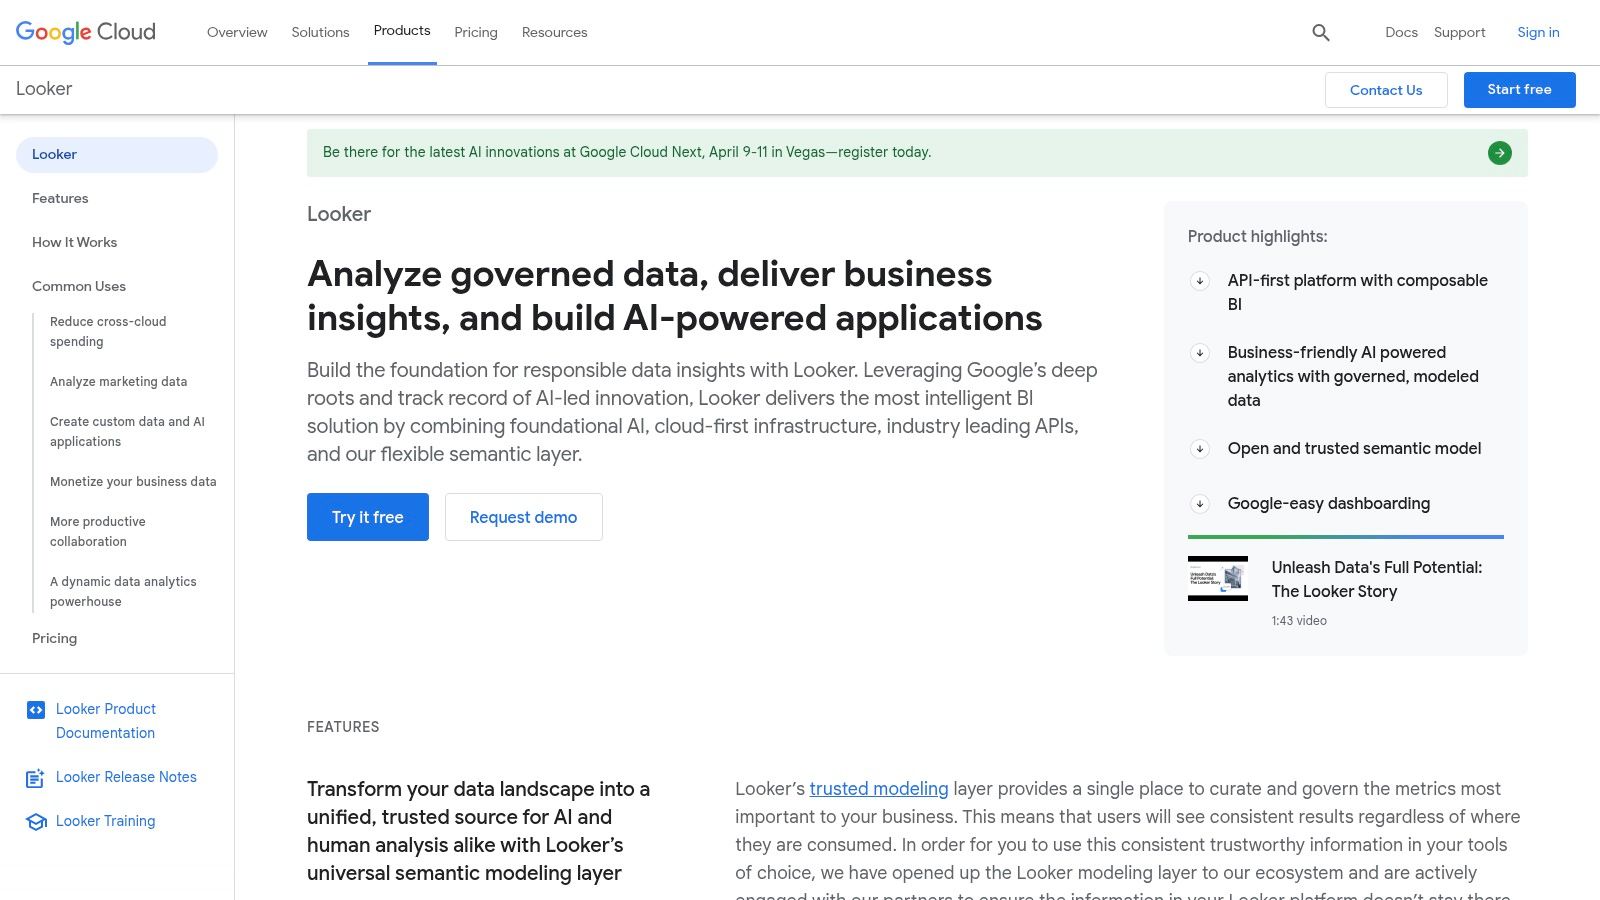
Looker, now a key part of the Google Cloud platform, delivers robust business intelligence (BI) and analytics for enterprise-level data exploration and sharing. At the heart of Looker is its LookML modeling language. This unique language separates the data modeling from the visualization, promoting strong data governance and consistent metrics across an organization. This approach also empowers users with self-service analytics, making Looker a strong player in the BI field. Its focus on data accuracy and scalability further solidifies its position in the market.
Looker truly excels where consistent reporting and data integrity are critical. Consider a large e-commerce company that needs to track sales performance across different regions, product lines, and marketing campaigns. LookML allows the data team to define core metrics like "revenue," "customer acquisition cost," and "conversion rate" just once. This single definition ensures that everyone in the organization uses the same figures. Marketing teams can then confidently build custom dashboards analyzing campaign effectiveness using these pre-defined metrics, knowing the data aligns perfectly with finance reports. This level of consistency is crucial for making sound, data-driven decisions.
Features and Benefits
Here's a closer look at what Looker offers:
-
LookML Modeling Language: This unique language creates a single source of truth for metrics, eliminating discrepancies and bolstering data governance. Any model adjustments automatically update across all dashboards and reports, maintaining complete consistency.
-
Git Integration: Looker integrates with Git for version control of LookML code. This encourages team collaboration, tracks changes, and allows for easy rollback if needed. This feature is particularly valuable for larger teams.
-
Direct Database Querying: Looker queries your data warehouse directly, providing real-time data for up-to-the-minute reporting and analysis. This is essential for time-sensitive decisions.
-
Embedded Analytics: Seamlessly embed Looker dashboards and reports directly into your applications or websites. This allows you to offer valuable insights to customers and partners.
-
Integration with Google Cloud Platform: Looker leverages the power and scalability of Google Cloud's infrastructure, including BigQuery, for seamless data storage and analysis.
Pros and Cons
Like any platform, Looker has its strengths and weaknesses:
Pros:
- Excellent data governance model: LookML ensures consistent metrics and definitions throughout the organization.
- Strong collaboration features: Git integration enables version control and collaborative work within data teams.
- Consistent metric definitions: Removes ambiguity and ensures everyone uses the same data.
- Modern cloud-native architecture: Utilizes the scalability and reliability of the Google Cloud Platform.
Cons:
- Higher price point: Looker targets enterprise clients and can be costly for smaller businesses.
- Requires SQL knowledge for advanced use: Basic use is possible without SQL, but deeper customization often requires SQL proficiency.
- Steeper learning curve for LookML: Mastering LookML requires an initial investment in training and practice.
- Less intuitive for casual business users: While self-service analytics is available, the interface may not be as intuitive as some visually-driven BI tools.
Implementation/Setup Tips
Here are a few tips for getting started with Looker:
- Clearly define your business requirements and key metrics before starting.
- Invest the time to learn LookML; it's fundamental to maximizing Looker's potential.
- Make use of the extensive documentation and community resources.
- Consider engaging Looker's professional services for initial setup and training.
Comparison With Similar Tools
Compared to tools like Tableau and Power BI, Looker's strength lies in its robust data modeling layer and emphasis on data governance. While Tableau and Power BI might offer a more intuitive visual experience for ad-hoc exploration, Looker excels at creating a single, reliable source of truth for metrics across an entire organization.
Getting Started with Looker
Visit the Looker website for more information and to explore its capabilities. Looker's robust data governance features and the powerful LookML modeling language make it a compelling option for organizations prioritizing data accuracy and consistency. While there's a higher price tag and some initial learning required, the ability to establish a single source of truth for metrics is incredibly valuable for data-driven decision-making, especially in larger organizations. For anyone working with data in a collaborative setting, Looker provides a powerful solution for turning data into actionable insights.
5. ThoughtSpot: Unleash the Power of Search-Driven Analytics
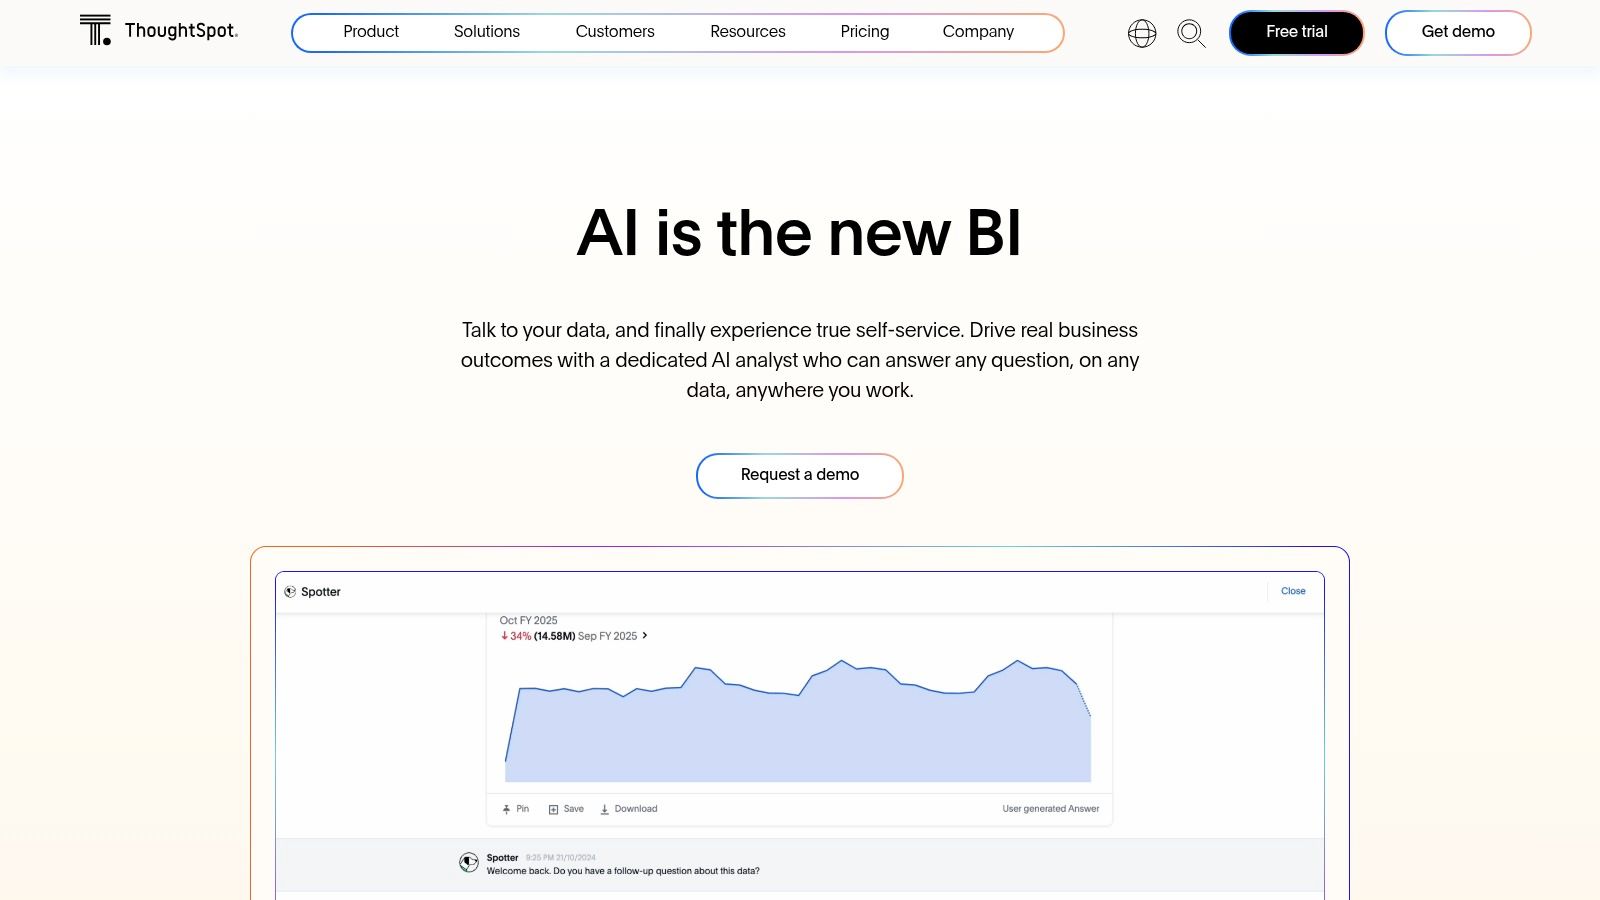
ThoughtSpot stands out by changing how we interact with data. Instead of complex dashboards and query languages, ThoughtSpot uses plain English questions, much like a search engine. This search-driven approach makes data exploration accessible to a wider audience, from non-technical business users and marketers to remote workers needing quick insights.
Imagine needing to analyze a marketing campaign's impact. Instead of sorting through endless reports, you could simply ask ThoughtSpot, "What was the conversion rate for the fall campaign by region?" The platform delivers instant, visually rich results. This speed and ease of access are key differentiators for ThoughtSpot.
Key Features and Benefits
ThoughtSpot offers a range of features designed to simplify data analysis:
- Natural Language Search: ThoughtSpot's core strength lies in understanding natural language, eliminating the need for specialized skills.
- SpotIQ AI-Driven Insights: The built-in AI engine, SpotIQ, proactively reveals hidden trends and anomalies, potentially uncovering valuable opportunities or risks.
- Embedded Analytics: Integrate ThoughtSpot into existing applications and workflows, providing data-driven insights within familiar tools.
- Relationship Search: Analyze data across multiple sources by asking questions that connect related information, simplifying complex relationships.
- Massive Data Scale Handling: ThoughtSpot handles the large datasets common in enterprises, ensuring quick performance even with billions of data points.
Pros and Cons
Like any platform, ThoughtSpot has its strengths and weaknesses:
Pros:
- Intuitive User Interface: The search-based interface is easy to learn and use.
- Performance with Large Datasets: ThoughtSpot's architecture is optimized for speed and efficiency, even with substantial datasets.
- Search-Based Approach: This approach simplifies the analytical process for a broader range of users.
- AI-Powered Insights: SpotIQ automatically provides valuable insights.
Cons:
- Premium Pricing: ThoughtSpot's advanced features come at a higher cost.
- Visualization Customization: Customization options might be less extensive than some traditional Business Intelligence (BI) tools like Tableau or Power BI.
- Structured Data Requirement: ThoughtSpot performs best with clean, well-structured data.
- Newer Platform: Fewer community resources are available compared to more established platforms.
Implementation and Setup Tips
Successful implementation requires planning and data preparation. Ensure your data is properly structured and cleaned before integration. ThoughtSpot provides documentation and professional services to help.
Comparison with Similar Tools
While tools like Tableau and Power BI excel at visualization and dashboards, ThoughtSpot's search-driven method makes it ideal for democratizing data access and empowering non-technical users.
Pricing
ThoughtSpot uses a custom pricing model based on data volume and user count. Contact their sales team for a quote.
Website
ThoughtSpot provides a new perspective on business intelligence, enabling users to find insights with the ease of a search engine. The intuitive interface and powerful AI-driven insights make it valuable for anyone seeking to maximize their data's potential.
6. Domo
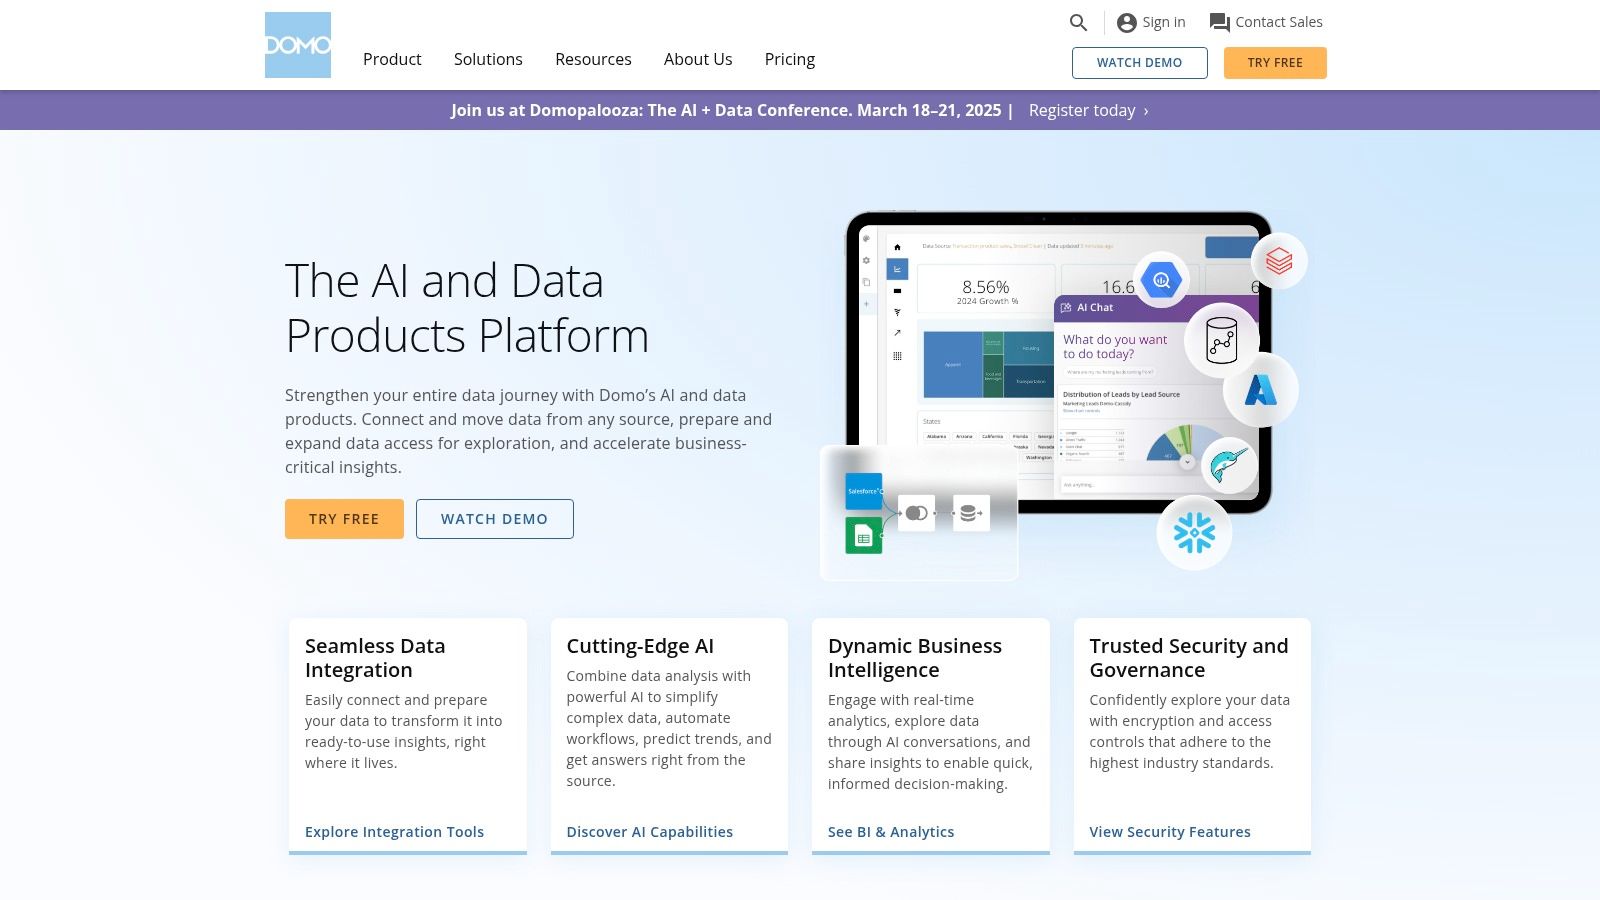
Domo secures a spot on this list as a powerful, all-in-one cloud-based business intelligence (BI) platform. Its strength lies in delivering real-time data insights, especially on mobile devices. Domo caters to businesses looking for a complete solution that integrates data from multiple sources, transforms it, and presents it in an accessible way. Imagine having essential business metrics, from sales figures to marketing ROI, readily available at your fingertips, wherever you are. This is the convenience that Domo provides.
Domo stands out with its over 1,000 pre-built connectors, enabling seamless integration with a wide range of data sources. Its built-in ETL (Extract, Transform, Load) capabilities, powered by Magic ETL, simplify data transformation and preparation, even for non-technical users. Collaborative features like Buzz and Cards allow for data sharing and discussion among teams, fostering a data-driven environment. Additionally, the Domo Appstore lets developers build custom apps, extending the platform's functionality to meet specific business requirements.
For business users, Domo's intuitive interface simplifies data exploration and analysis. Executives can track key performance indicators (KPIs) through customizable dashboards, while marketing teams can monitor campaign performance and spot trends in real time. Sales teams benefit from access to up-to-the-minute sales data on their mobile devices, enabling them to make informed decisions on the go.
Features
- Over 1,000 pre-built connectors for data integration
- Built-in ETL capabilities with Magic ETL
- Collaborative features like Buzz and Cards
- Custom app development with Domo Appstore
- Enterprise-grade security and governance
- Excellent mobile experience
Pros
- Comprehensive all-in-one platform
- Excellent mobile experience
- Strong data integration capabilities
- User-friendly interface for business users
Cons
- Higher cost structure
- Limited advanced customization
- Can be complex for full implementation
- Less transparency in pricing model
Pricing
Domo's pricing isn't publicly available; a custom quote is required from their sales team. This lack of transparency might be a disadvantage for some.
Technical Requirements
As a cloud-based platform, Domo has minimal technical requirements. Users mainly need a reliable internet connection and a web browser.
Comparison
While comparable to tools like Tableau and Power BI in data visualization, Domo distinguishes itself with its comprehensive approach. It combines data integration, warehousing, and visualization in a single platform. Domo is particularly well-suited for businesses that prioritize mobile access to real-time information.
Implementation Tips
Begin with a clear understanding of your business needs and data sources. Using Domo's professional services for initial setup and training can considerably simplify implementation and maximize the platform's benefits. You might be interested in: Our guide on…
Website
7. Sisense
Sisense stands out for its robust AI-driven analytics and ability to handle complex data, particularly for embedded analytics. This platform effectively bridges the gap between data analysts and business users, equipping them with the tools to create interactive, data-rich applications. Imagine enriching your customer-facing product with advanced analytics, delivering data-driven insights that boost user experience and engagement. That's where Sisense excels.
The core strength of Sisense lies in its In-Chip™ technology. This innovative database engine processes large datasets rapidly, enabling near real-time analysis and interactive dashboards. This speed is essential for businesses handling high data volumes, whether it's a streaming platform analyzing user behavior or digital marketers monitoring campaign performance. For example, a streaming service could use Sisense to analyze viewing patterns, pinpoint trending content, and personalize recommendations instantly, ultimately improving customer satisfaction and retention.
Beyond its performance capabilities, Sisense offers a comprehensive suite of features:
- Embedded Analytics Framework: Integrate analytics seamlessly into existing applications, websites, or portals, creating white-labeled, interactive dashboards for clients or internal use.
- Elastic Data Models: Manage complex data relationships without rigid pre-defined schemas for greater analytical flexibility. This is especially beneficial for businesses with rapidly evolving data structures.
- AI-Powered Insights with Sisense BloX: Utilize machine learning to automate data discovery, identify trends, and surface actionable insights with minimal manual input. Imagine automatically identifying key performance indicators (KPIs) for marketing campaigns without writing complex queries.
- White-labeling Capabilities: Fully customize the appearance of your analytics dashboards to align with your brand, ensuring a consistent and professional user experience.
Pros and Cons of Using Sisense
Understanding the advantages and disadvantages of any platform is crucial before implementation. Here’s a quick look at Sisense:
Pros:
- Exceptional performance with complex data makes it well-suited for data-intensive industries.
- Robust embedded analytics capabilities differentiate it from many competitors.
- Flexible deployment options cater to diverse needs and infrastructure.
- Balances ease of use for business users with advanced features for technical experts.
Cons:
- Steeper administrative learning curve compared to some simpler BI tools.
- Premium pricing requires a significant investment.
- While user-friendly in many aspects, some features demand technical expertise.
- Some users may find the dashboard design interface less intuitive than alternatives like Tableau or Power BI.
Pricing, Technical Requirements, and Implementation
Pricing: Sisense offers custom pricing tailored to specific needs and usage. Contact their sales team for a personalized quote.
Technical Requirements: Sisense supports on-premises, cloud, or hybrid deployments. Specific requirements vary based on the chosen deployment and data scale.
Implementation/Setup Tips:
- Clearly define your business objectives and how embedded analytics will contribute.
- Collaborate with Sisense's professional services or implementation partners for smooth onboarding.
- Invest in training for administrators and users to fully utilize the platform's potential.
Comparing Sisense to Other BI Tools
Compared to tools like Tableau and Power BI, Sisense prioritizes embedded analytics and performance with complex data. While Tableau and Power BI excel in visualization and self-service analytics, Sisense focuses on organizations needing to integrate advanced analytics directly into their products or services.
Final Thoughts on Sisense
Website: https://www.sisense.com/
Sisense is a powerful tool for organizations seeking a data-driven competitive advantage. Its focus on embedded analytics, coupled with its capacity to handle complex datasets, makes it a valuable asset for tech enthusiasts, business professionals, and digital marketers. While the higher price and learning curve should be considered, its capabilities can deliver substantial ROI for businesses requiring advanced analytics and data-driven decision-making.
8. SAP BusinessObjects
SAP BusinessObjects is a comprehensive suite of business intelligence (BI) tools for enterprise-level reporting, analysis, and data visualization. It’s a powerful platform particularly well-suited for large organizations, especially those already working within the SAP ecosystem, that need robust reporting and strong data governance. While BusinessObjects excels in its enterprise-grade features, it's important to be aware of its complexity and associated costs.
Practical Applications and Use Cases:
- Financial Reporting: Create complex financial statements, regulatory reports, and performance dashboards.
- Sales and Marketing Analysis: Analyze sales trends, customer behavior, and campaign effectiveness.
- Operations Management: Monitor key performance indicators (KPIs), optimize supply chains, and track production efficiency.
- Data Warehousing and Reporting: Build enterprise data warehouses and create standardized reports across the organization.
- Predictive Analytics: Use historical data to forecast future trends and inform data-driven decisions.
Key Features and Benefits
-
Integrated Suite of Tools: BusinessObjects includes several tools like Web Intelligence (WebI) for ad-hoc reporting, Crystal Reports for pixel-perfect formatted reports, and Lumira for data discovery and visualization. This integrated approach streamlines various BI tasks.
-
Centralized Semantic Layer (Universe): The Universe acts as a business-friendly layer, abstracting the technical complexities of underlying data sources. This simplifies data access for non-technical users.
-
Enterprise-Grade Security and Administration: Robust security features ensure data integrity and access control based on pre-defined roles and permissions.
-
Self-Service Data Discovery: Tools like Lumira empower business users to explore data, create visualizations, and uncover insights independently.
-
Multi-Source Data Integration: Connects to a variety of data sources, including both SAP and non-SAP systems, providing a unified view of organizational data.
Pros and Cons
Pros:
- Comprehensive Enterprise Reporting: Excels at complex reporting requirements, offering a wide range of formats and delivery options.
- Strong Data Governance: Ensures data accuracy, consistency, and security through a centralized semantic layer and robust security model.
- SAP Ecosystem Integration: Seamlessly integrates with other SAP products, making it a natural choice for organizations already using SAP software.
- Robust Security Model: Offers granular control over data access and ensures compliance with regulatory requirements.
Cons:
- Dated User Interface: The user interface can feel less intuitive and visually appealing than some more modern BI tools.
- Complex Implementation: Requires specialized skills and resources for initial implementation and ongoing maintenance.
- High Total Cost of Ownership: Licensing, implementation, and maintenance costs can be significant.
- Slower Innovation: Cloud-native competitors often release updates and new features more frequently.
Pricing, Technical Requirements, and Implementation
SAP BusinessObjects licensing is typically based on named users or concurrent users. Pricing varies depending on the specific tools and features included. Technical requirements depend on the chosen deployment model (on-premise, cloud, or hybrid) and the specific components used. Contact SAP directly for detailed pricing and technical information.
Implementation Tips:
- Planning: Define clear objectives, identify key stakeholders, and assess existing infrastructure.
- Training: Ensure users are adequately trained on the various tools and features.
- Pilot Project: Test the implementation in a controlled environment before a full organizational rollout.
- SAP Expertise: Leverage your existing SAP team’s expertise if you already use SAP software.
Comparison and Justification
Compared to tools like Power BI or Tableau, SAP BusinessObjects offers more robust enterprise-grade features, especially regarding security and governance. However, it prioritizes these features over ease of use and a modern interface. Power BI and Tableau are often preferred for their agility and user-friendliness, while BusinessObjects is chosen for its enterprise capabilities and tight integration with SAP landscapes. Despite its complexity and cost, SAP BusinessObjects remains a key player in the enterprise BI market. Its comprehensive features, strong data governance, and seamless integration with the SAP ecosystem make it a valuable tool for large organizations with complex reporting needs.
Website: https://www.sap.com/products/technology-platform/bi-analytics-software.html
9. MicroStrategy
MicroStrategy is a robust business intelligence (BI) platform designed for enterprise-level organizations. It caters to those needing advanced analytics and reporting capabilities. Its focus is on scalability, security, and comprehensive data handling, making it a solid choice for businesses with complex data needs.
While often compared to tools like Tableau and Power BI, MicroStrategy differentiates itself through its ability to manage and analyze massive datasets across an entire enterprise. This is particularly advantageous for large corporations with intricate data warehousing requirements.
Key Features and Benefits
MicroStrategy empowers organizations to glean valuable insights from their data. One key feature, HyperIntelligence®, delivers zero-click insights directly within existing applications and workflows.
Its enterprise semantic layer ensures data consistency and facilitates self-service analytics. Federated analytics allows users to analyze data from disparate sources without requiring data migration.
Interactive dashboards, known as Dossiers, offer visually appealing and dynamic data exploration. Robust mobile capabilities extend the reach of BI to users on the go.
Industry Applications
MicroStrategy finds practical applications across various industries. Financial institutions use it for risk analysis and fraud detection. Retailers leverage its capabilities for inventory optimization and customer segmentation. Healthcare organizations utilize it for patient analytics and improvements in operational efficiency.
Its value is particularly evident for organizations needing to centralize and govern their data while simultaneously enabling departmental access and analysis.
Features:
- HyperIntelligence® for zero-click insights
- Enterprise semantic layer
- Federated analytics across data sources
- Dossier-based interactive dashboarding
- Sophisticated mobile capabilities
Pros:
- Superior enterprise-grade security
- Excellent scalability for large deployments
- Strong mobile analytics capabilities
- Comprehensive data connectivity options
Cons:
- Steeper learning curve compared to user-friendly tools
- Higher cost of implementation and significant investment
- More IT-dependent than self-service BI tools
- Complex administration demanding specialized expertise
Pricing and Implementation
MicroStrategy's pricing is typically subscription-based and scaled to the organization's size and needs. Technical requirements vary based on deployment choices (on-premises, cloud, or hybrid). Generally, robust server infrastructure is required for optimal performance.
Successful MicroStrategy implementations begin with a well-defined scope and clear business objectives. Early IT engagement ensures proper infrastructure and data integration. Phased rollouts, starting with specific departments or use cases, manage complexity and improve user adoption. For additional tech resources, explore our site's content map.
MicroStrategy's robust features and enterprise-grade capabilities justify its inclusion on this list. While complexity and cost might be prohibitive for smaller organizations, its power and scalability are invaluable for large enterprises needing a comprehensive BI solution. For those seeking powerful, secure, and scalable enterprise-grade BI, MicroStrategy is a serious contender. Learn more at the MicroStrategy website.
10. IBM Cognos Analytics
IBM Cognos Analytics is a powerful, AI-driven business intelligence (BI) platform designed for the needs of large enterprises. While it may not be the easiest tool for individuals to pick up, its comprehensive features and strong data governance make it a solid choice for organizations wanting to streamline their reporting and analysis. Cognos Analytics successfully bridges the gap between IT-managed reporting and self-service analytics, making it valuable for both technical and business users.
Cognos Analytics empowers users to explore data, build interactive dashboards, produce detailed reports, and visualize key insights with AI-powered recommendations. Consider a marketing team tracking campaign effectiveness across various channels. Cognos Analytics can collect data from multiple sources, create visualizations of each channel's ROI, and even predict future performance based on past trends.
A financial analyst, on the other hand, might use Cognos Analytics to model different budget scenarios and forecast potential outcomes. The platform's natural language processing capabilities simplify data exploration even further, enabling users to pose questions using everyday language and receive relevant information in return.
Key Features and Benefits
- AI-Assisted Data Exploration: Cognos Analytics helps users find valuable insights by recommending visualizations and highlighting key data points. This speeds up the entire discovery process.
- Natural Language Query Capabilities: Ask questions in plain English and get quick answers without needing to write complex queries.
- Enterprise Reporting and Scheduling: Create pixel-perfect reports and automate their distribution to stakeholders.
- Guided Data Visualization Recommendations: The platform simplifies dashboard creation by suggesting the best chart types and visualizations based on the data provided.
- Role-Based Access Control: This feature maintains data security and regulatory compliance by managing access to sensitive data according to user roles.
Pros
- Strong Enterprise Reporting Capabilities: Cognos is well-known for its robust reporting, ideal for complex, pixel-perfect reports.
- Robust Data Governance: Offers granular control over data access and security, critical for compliance and data integrity.
- AI-Powered Assistant for Insights: This accelerates data exploration and helps reveal hidden trends.
- Comprehensive Platform for Diverse Analytics Needs: Cognos Analytics covers a wide spectrum of BI needs, from ad-hoc analysis to scheduled enterprise reporting.
Cons
- Interface Can Be Complex for New Users: The platform's many features can create a steeper learning curve.
- Implementation Requires Significant Resources: Setting up and configuring Cognos Analytics can be resource-intensive and may require specialized expertise.
- Higher Total Cost of Ownership: When compared to other BI tools, Cognos Analytics can be more expensive, especially for smaller businesses.
- Performance Can Be Inconsistent with Large Datasets: Processing very large datasets can sometimes cause performance problems.
Pricing and Technical Requirements
IBM offers tiered pricing for Cognos Analytics based on user types and features. For detailed pricing information, it's best to contact IBM directly. Technical requirements depend on the deployment option chosen (on-premises or cloud). You can find detailed system requirements on the IBM website.
Implementation/Setup Tips
- Start with a Clear Understanding of Your Business Needs: Define your reporting and analysis requirements before implementing Cognos Analytics.
- Engage with IBM or a Certified Partner: Make the most of their expertise for a smoother implementation process.
- Invest in Training for Your Users: This will help ensure your team can effectively use all of the platform's features.
- Start with a Pilot Project: Beginning with a smaller project allows you to test the platform and refine your implementation strategy.
Comparison with Similar Tools
Cognos Analytics competes with other enterprise BI platforms such as Tableau, Power BI, and MicroStrategy. While these tools offer similar functions, Cognos stands out due to its emphasis on enterprise reporting, strong data governance, and AI-powered assistance. However, it might not be as user-friendly or visually appealing as some competitors.
Website: https://www.ibm.com/products/cognos-analytics
Top 10 BI Tools: Side-by-Side Comparison
| Platform | Core Features ✨ | User Experience ★ | Value Proposition 💰 | Target Audience 👥 |
|---|---|---|---|---|
| Tableau | Drag-and-drop visuals, diverse data connectors, analytics | Intuitive & interactive | Comprehensive & powerful | All technical levels |
| Microsoft Power BI | Microsoft integration, natural language queries, AI | Cost-effective & updated | Seamless ecosystem integration | Business users & enterprises |
| Qlik Sense | Associative engine, self-service analytics, augmented insights | Exploratory & robust | Powerful data governance | Data-driven organizations |
| Looker (Google Cloud) | LookML modeling, real-time querying, cloud-native | Modern yet SQL-dependent | Consistent metrics & collaboration | Enterprises & analytics teams |
| ThoughtSpot | Natural language search, AI-driven insights, search-based analysis | Intuitive & innovative | Instant insights & high performance | Enterprises & non-technical users |
| Domo | Pre-built connectors, Magic ETL, mobile dashboards | User-friendly & mobile-optimized | All-in-one integrated platform | Business professionals & teams |
| Sisense | In-Chip processing, AI insights, embedded analytics | Powerful with a learning curve | High-performance analytics | Embedded analytics users & enterprises |
| SAP BusinessObjects | Enterprise reporting, semantic layer, multi-source integration | Robust but dated | Comprehensive reporting & governance | Large enterprises, SAP users |
| MicroStrategy | HyperIntelligence, semantic layer, mobile BI | Scalable & secure | Superior enterprise analytics | Large-scale enterprises |
| IBM Cognos Analytics | AI-driven exploration, reporting dashboards, natural language queries | Comprehensive yet complex | Enterprise-grade insights & governance | Enterprises & analytics professionals |
Making Your Data Work For You
Choosing the right Business Intelligence (BI) tool is a significant step towards harnessing the power of your data. With a market saturated with options, from established players like Tableau and Microsoft Power BI to emerging solutions like ThoughtSpot and Domo, navigating the selection process can be overwhelming. This guide has provided a comparative look at ten leading BI tools, highlighting their strengths and weaknesses to help you make an informed decision.
Picking the ideal platform involves more than just comparing features. Consider these factors when making your choice:
-
Your Specific Needs: Do you need robust data visualization capabilities like Tableau offers? Is embedded analytics crucial, making Looker a good fit? Or perhaps you require the advanced AI-driven analytics provided by ThoughtSpot. Define your core requirements before exploring the options.
-
Implementation and Getting Started: Some tools, like Power BI, are known for their user-friendly interfaces and relatively easy setup. Others, like SAP BusinessObjects, might require more technical expertise for implementation and ongoing management. Evaluate your available internal resources and skillsets.
-
Budget and Resource Considerations: BI tools come with varying pricing models, from subscription-based services to perpetual licenses. Consider the total cost of ownership, including potential training costs, ongoing maintenance, and the need for dedicated IT support. Free trials and demos are invaluable for testing the platforms within your budget.
-
Integration and Compatibility: Ensure the chosen tool integrates seamlessly with your existing data infrastructure. Compatibility with your data warehouses, databases, and cloud platforms is crucial for smooth data flow and efficient analysis. Consider whether the tool supports data blending and transformation capabilities to handle diverse data sources.
Key Takeaways
-
User-Friendliness vs. Advanced Features: Some platforms cater to business users with intuitive drag-and-drop interfaces, while others offer more advanced features for data scientists and analysts.
-
Cloud vs. On-Premise: Consider your infrastructure and security requirements when choosing between cloud-based or on-premise deployment options.
-
Scalability and Performance: Ensure the chosen platform can handle your data's volume and complexity as your business grows.
-
Community and Support: A strong community and readily available support resources can be invaluable when you face technical challenges.
By carefully comparing BI tools like Tableau, Microsoft Power BI, Qlik Sense, Looker, ThoughtSpot, Domo, Sisense, SAP BusinessObjects, MicroStrategy, and IBM Cognos Analytics and considering your specific needs, you can unlock valuable insights, improve decision-making, and gain a competitive edge. Take advantage of free trials and demos to experience each platform firsthand. Empower your business with the right BI platform today!


